Lesson 3: Bokeh: bar plot
LESSON 3.1: vbar 垂直長條圖
LESSON 3.2: hbar 水平長條圖
LESSON 3.3: Stacked bar plot
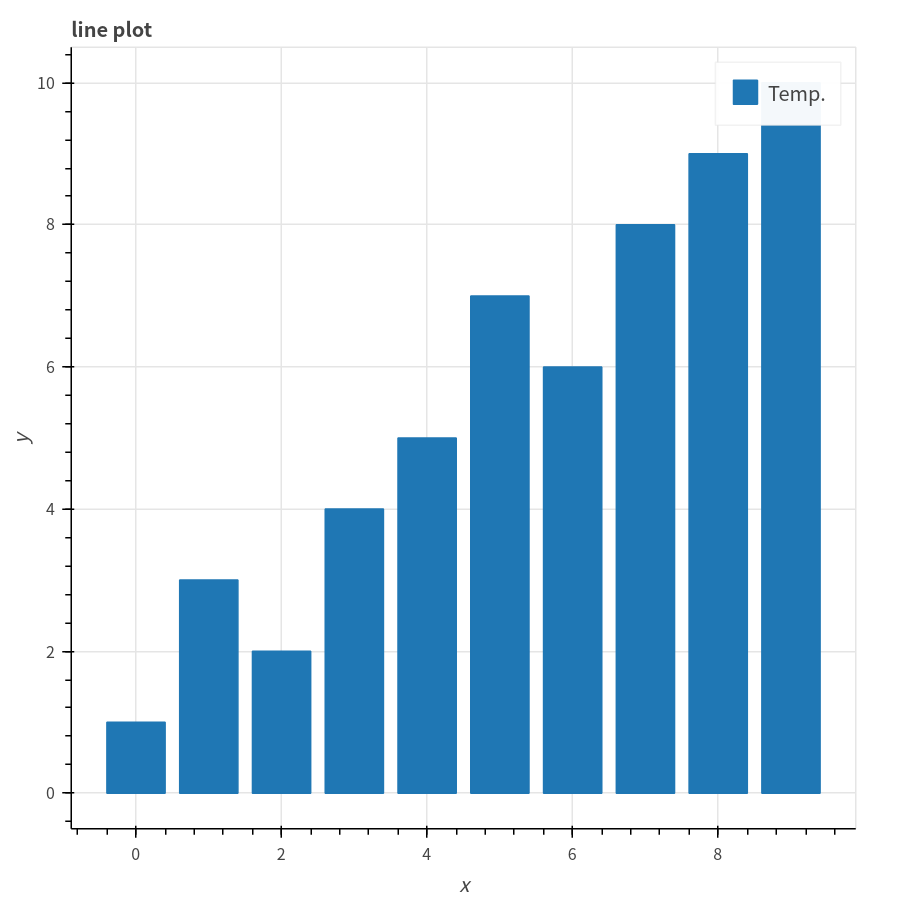
Lesson 3.1: vbar 垂直長條圖
畫出vbar 垂直長條圖,並存成html檔
Example Code
from bokeh.plotting import figure, output_file, show
x = range(0,10)
y = [1, 3, 2, 4, 5, 7, 6, 8, 9, 10]
output_file("BokehVBar.html")
p = figure(title="line plot", x_axis_label='x', y_axis_label='y')
p.vbar(x, top=y, legend="Temp.", bottom=0, width=0.8)
show(p)
Note and Comments
from bokeh.plotting import figure, output_file, show :匯入bokeh函式庫.
p.vbar(x, top=y, legend="Temp.", bottom=0, width=0.8))  : 繪製垂直長條圖, 函數原形為: p.vbar(x軸資料, top=y軸資料點, bottom=強條圖起點. 圖例名稱legend, 標記顏色color, width= 長條圖寬度)
show(p)
result
點下列圖形可直接觀看顯示結果.
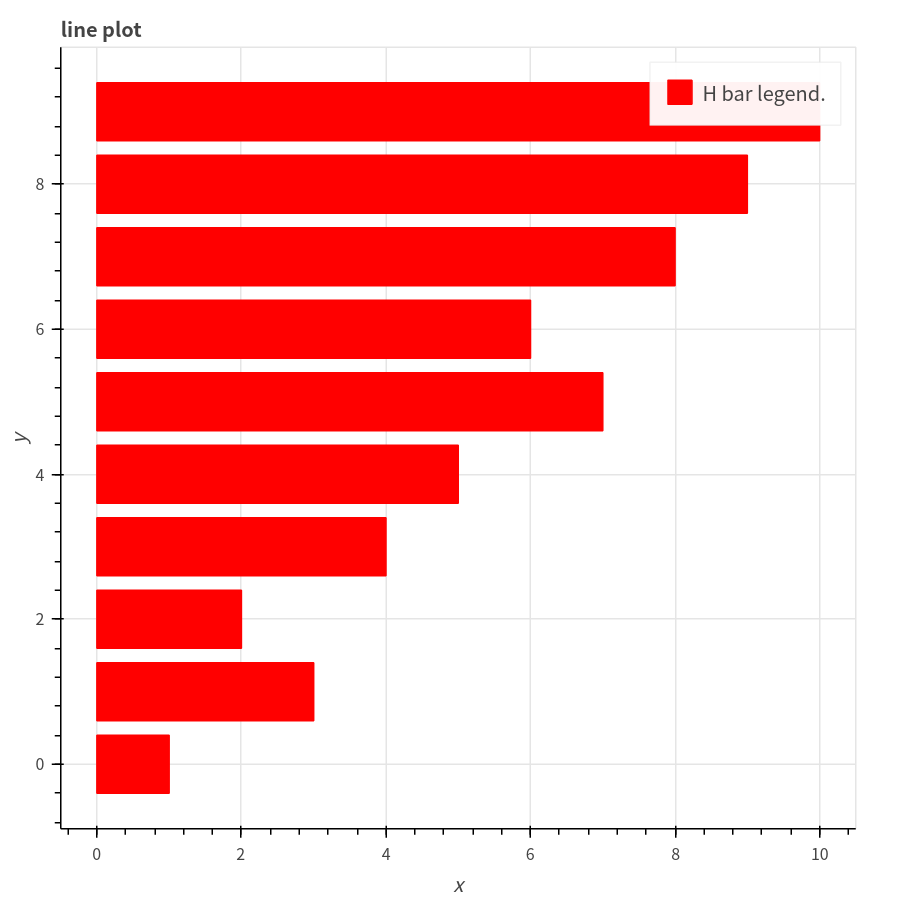
 Lesson 3.2: 繪製水平長條圖
Example Code
Lesson 3.2: 繪製水平長條圖
Example Code
from bokeh.plotting import figure, output_file, show
x = range(0,10)
y = [1, 3, 2, 4, 5, 7, 6, 8, 9, 10]
output_file("BokehHBar.html")
p = figure(title="line plot", x_axis_label='x', y_axis_label='y')
p.hbar(y=x, right=y, legend="H bar legend.", left=0, height=0.8, color="red")
show(p)
Note and Comments
from bokeh.plotting import figure, output_file, show :匯入bokeh函式庫.
p.hbar(y=x, right=y, legend="H bar legend.", left=0, height=0.8, color="red"): 繪製水平長條圖, 函數原形為: p.hbar(y=y軸資料, right=y軸資料點, left=長條圖起點. 圖例名稱legend, 標記顏色color, height= 長條圖寬度)
show(p)
點下列圖形可直接觀看顯示結果.
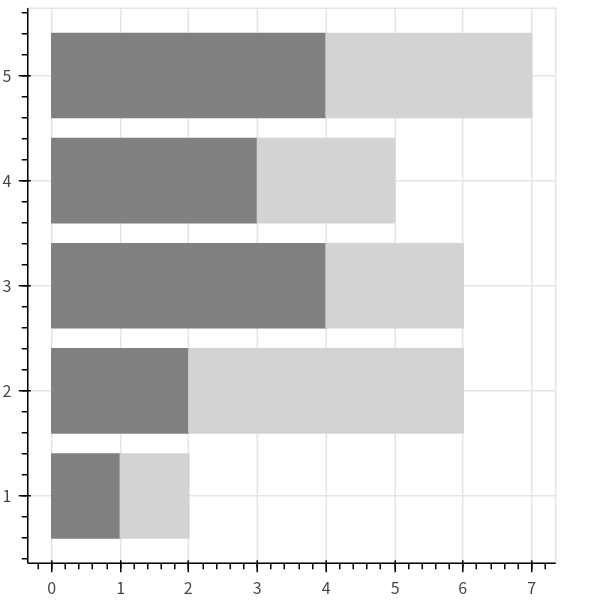
Lesson 3.3: Stacked bars
Example Code
from bokeh.models import ColumnDataSource
from bokeh.plotting import figure, output_file, show
output_file("hbar_stack.html")
source = ColumnDataSource(data=dict(
    y=[1, 2, 3, 4, 5],
    x1=[1, 2, 4, 3, 4],
    x2=[1, 4, 2, 2, 3],
))
p = figure(plot_width=400, plot_height=400)
p.hbar_stack(['x1', 'x2'], y='y', height=0.8, color=("grey", "lightgrey"), source=source)
show(p)
Note and Comments
from bokeh.plotting import figure, output_file, show :匯入bokeh函式庫.
p.hbar_stack(['x1', 'x2'], y='y', height=0.8, color=("grey", "lightgrey"), source=source): 繪製stacked長條圖, 函數原形為: p.hbar_stack(X軸資料名稱, y=y軸資料名稱, height= 長條圖寬度, 圖例名稱legend, color=標記顏色, 須分別對x軸資料給定顏色, source=資料)
show(p)
點下列圖形可直接觀看顯示結果.