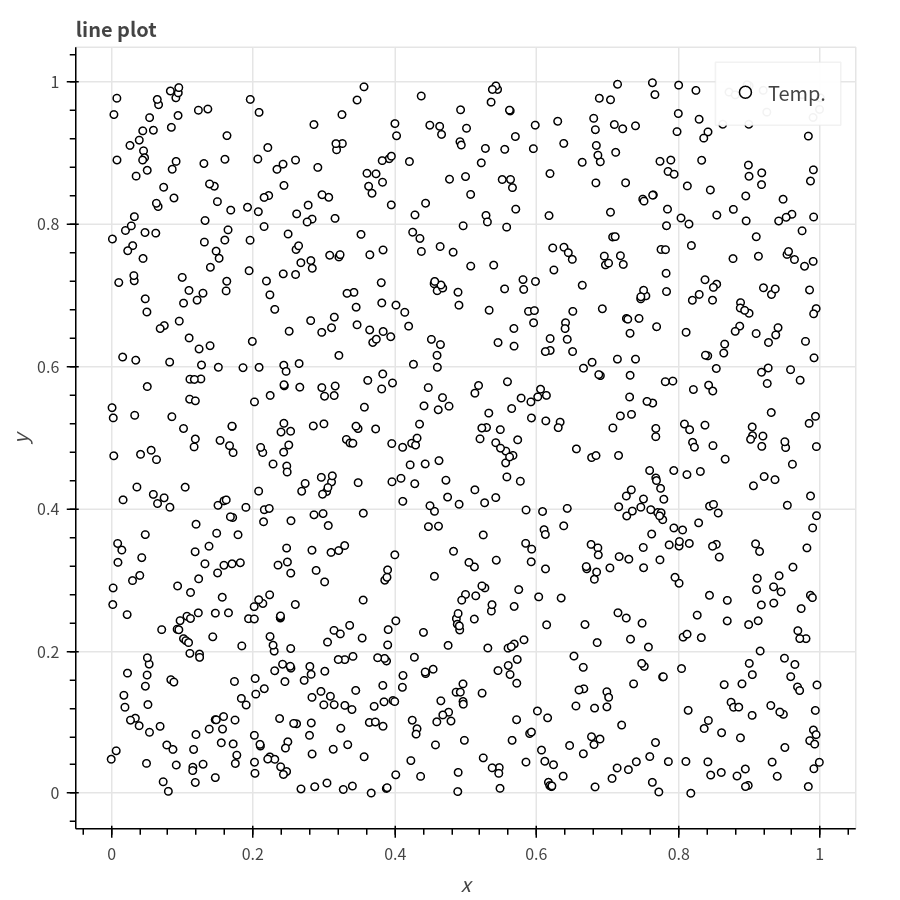
Lesson 2.1: scatter plot 散佈圖
畫出圓形散佈圖,並存成html檔
Example Code
from bokeh.plotting import figure, output_file, show
import import scipy as sp
DistX = sp.random.rand(2,1000)
output_file("BokehLinePlot2.html")
p = figure(title="circle plot", x_axis_label='x', y_axis_label='y')
p.circle(DistX[0], DistX[1], legend="random destribution.", color="black", fill_color="white", size=5)
show(p)
Note and Comments
from bokeh.plotting import figure, output_file, show:匯入bokeh函式庫.
import scipy as sp :匯入scipy函式庫.
DistX = sp.random.rand(2,1000) 利用scipy函式庫中的random.rand函式產生兩組範圍為0-1,每組數據包含一千個隨機數.
output_file("BokehLinePlot2.html")  : 設定匯出的html名稱
p = figure(title="circle plot", x_axis_label='x', y_axis_label='y') : 設定圖形基本框架資料, title:標題, x_axis_label:x軸名稱, , y_axis_label:y軸名稱
p.circle(DistX[0], DistX[1], legend="random destribution.", color="black", fill_color="white", size=5)  : 繪製圓形散佈圖, 函數原形為: p.circle(x軸資料, y軸資料, 圖例名稱legend, 標記顏色color, 標記內部顏色fill_color, 標記大小size)
show(p)
result
點下列圖形可直接觀看顯示結果.
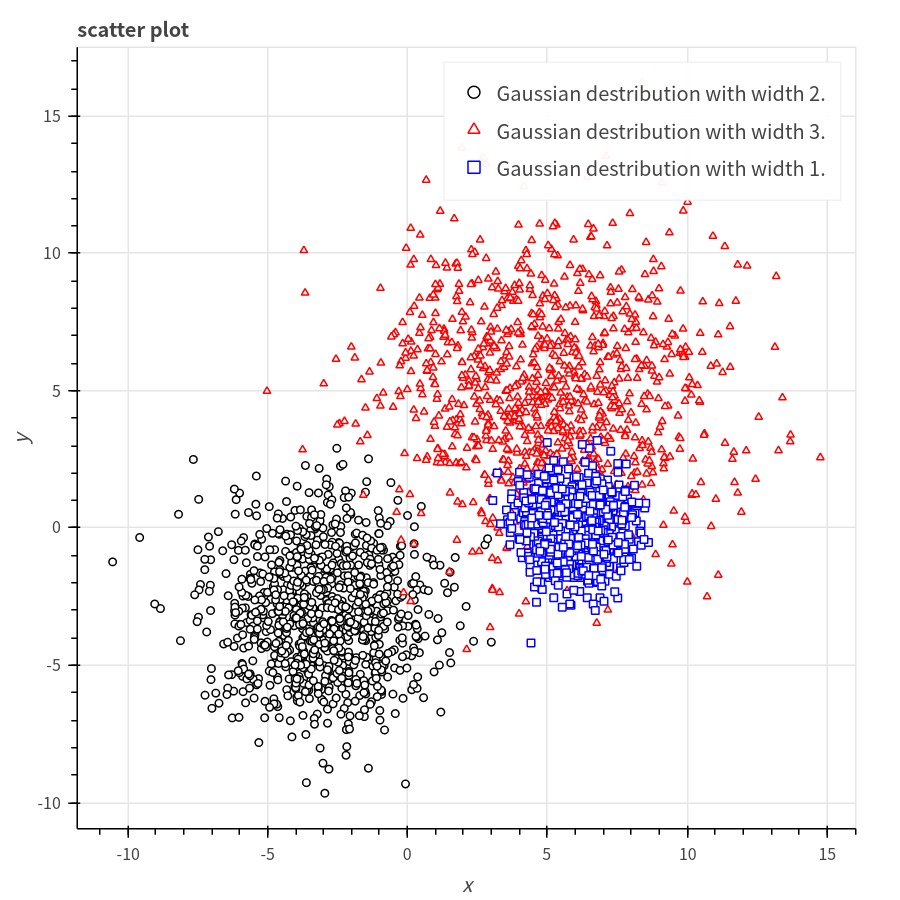
 Lesson 2.2: 繪製散布圖
Example Code
Lesson 2.2: 繪製散布圖
Example Code
from bokeh.plotting import figure, output_file, show
import scipy as sp
x1 = 3 + 5 * sp.random.randn(1000)
y1 = 3 + 5 * sp.random.randn(1000)
x2 = 5 + 3 * sp.random.randn(1000)
y2 = 5 + 3 * sp.random.randn(1000)
x3 = 6 + 6 * sp.random.randn(1000)
y3 = 8 + 6 * sp.random.randn(1000)
output_file("BokehLinePlot4.html")
p = figure(title="scatter plot", x_axis_label='x', y_axis_label='y')
p.circle(x1, y1, legend="random destribution.", color="black", fill_color="white", size=5)
p.triangle(x2, y2, legend="random destribution.", color="red", fill_color="white", size=5)
p.square(x3, y3, legend="random destribution.", color="blue", fill_color="white", size=5)
show(p)
Note and Comments
from bokeh.plotting import figure, output_file, show:匯入bokeh函式庫.
import scipy as sp :匯入scipy函式庫.
x1 = 3 + 5 * sp.random.randn(1000) : 產生1000個以中心為3,半高寬為5的高斯亂數分佈
y1 = 3 + 5 * sp.random.randn(1000)
x2 = 5 + 3 * sp.random.randn(1000)
y2 = 5 + 3 * sp.random.randn(1000)
x3 = 6 + 6 * sp.random.randn(1000)
y3 = 8 + 6 * sp.random.randn(1000)
output_file("BokehLinePlot4.html")
p = figure(title="scatter plot", x_axis_label='x', y_axis_label='y')
p.circle(x1, y1, legend="random destribution.", color="black", fill_color="white", size=5) : 圓形散布圖
p.triangle(x2, y2, legend="random destribution.", color="red", fill_color="white", size=5) : 三角散布圖
p.square(x3, y3, legend="random destribution.", color="blue", fill_color="white", size=5) : 方形散布圖
show(p)
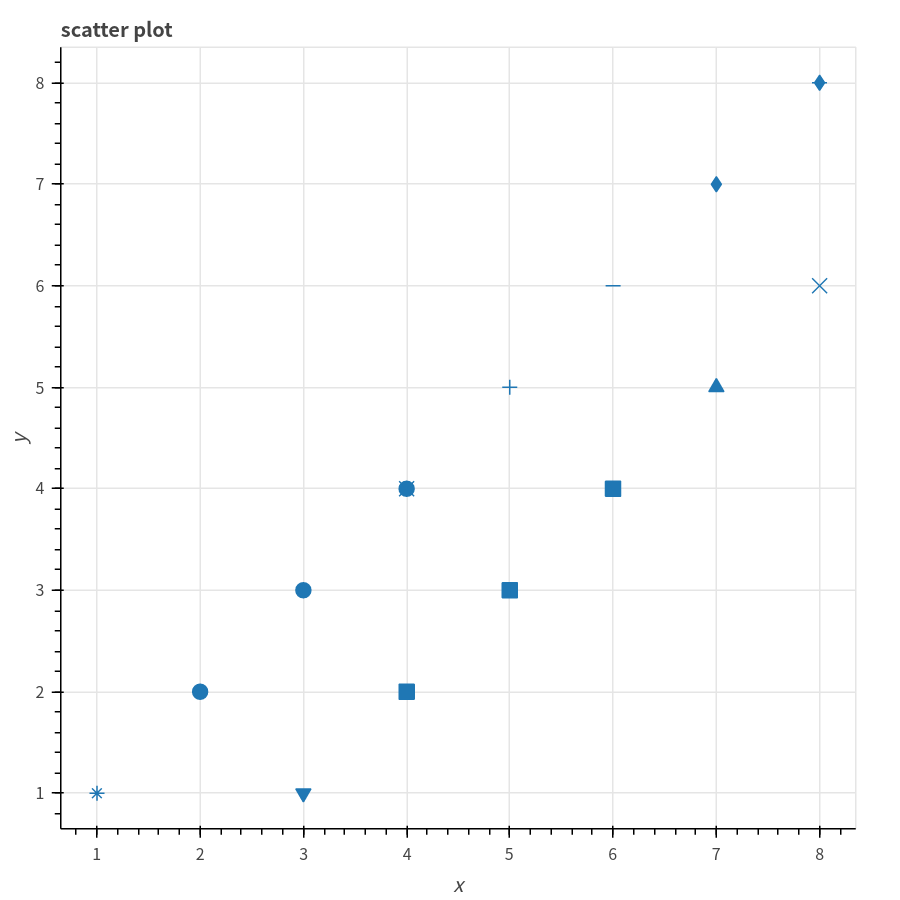
: 其他標記圖形 asterisk(), circle(), circle_cross(), circle_x(), cross(), dash(), diamond(), diamond_cross(), inverted_triangle(), square(), square_cross(), square_x(), triangle(), x()
點下列圖形可直接觀看顯示結果.
Lesson 2.4: 進階: scatter plot 散佈圖
引入鳩尾花資料, 並畫出散佈圖
Example Code
from bokeh.plotting import figure, output_file, show
from bokeh.plotting import figure, show
from bokeh.sampledata.iris import flowers
from bokeh.transform import factor_cmap, factor_mark
SPECIES = ['setosa', 'versicolor', 'virginica']
MARKERS = ['hex', 'circle_x', 'triangle']
output_file("BokehScatter14.html")
p = figure(title = "Iris Morphology")
p.xaxis.axis_label = 'Petal Length'
p.yaxis.axis_label = 'Sepal Width'

p.scatter("petal_length", "sepal_width", source=flowers, legend="species", fill_alpha=0.4, size=12,
          marker=factor_mark('species', MARKERS, SPECIES),
          color=factor_cmap('species', 'Category10_3', SPECIES))

show(p)
點下列圖形可直接觀看顯示結果.