Lesson 06: 1D plots with random function 隨機函數與一維作圖
Lesson 6: 1D plot with 1000*3 random data points
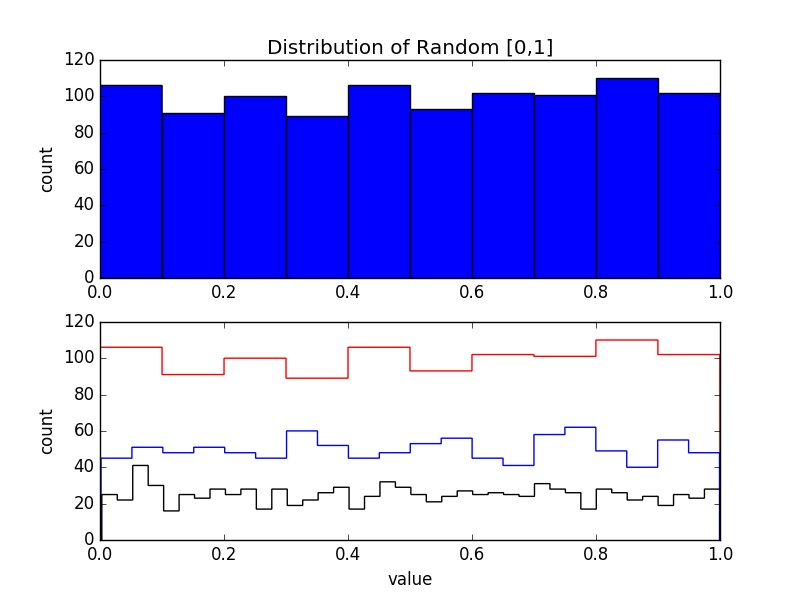
產生3000個數值介於0-1的亂數,每1000個為一組並畫出長條分佈圖
Example Code
- import numpy as np;
- import matplotlib.pyplot as plt;
- Distri1 = np.random.rand(3,1000)
- plt.figure(1)
- plt.subplot(211)
- plt.title(r'Distribution of Random [0,1]')
- plt.ylabel('count')
- plt.hist(Distri1[0], bins=10, histtype='bar', normed=False)
- plt.subplot(212)
- plt.hist(Distri1[0], bins=10, histtype='step',color='red', normed=False)
- plt.hist(Distri1[1], bins=20, histtype='step',color='blue', normed=False)
- plt.hist(Distri1[2], bins=40, histtype='step',color='black', normed=False)
- plt.xlabel('value')
- plt.ylabel('count')
- plt.show()
Note and Comments
- import matplotlib.pyplot as plt 匯入圖形函式庫Matplotlib中的pyplot資料庫, 並命名爲plt 產生m個0到1的隨機數
- plt.figure(1) 宣告一個圖像的視窗
- plt.subplot(lmn) 圖像視窗有l行*m列個圖, 我們目前使用第一個圖
- plt.title(r'Distribution of Random [0,1]') 第一個圖的名稱爲 Distribution of Random [0,1]
- plt.ylabel('count') 設定y軸的名稱, plt.xlabel('count') 設定x軸的名稱
- plt.hist(Distri1[0], bins=10, histtype='bar', normed=False) 繪一維長條圖, 資料點爲Distri1[0]序列
- histtype='xxxx' 設定長條圖的格式: bar與stepfilled爲不同形式的長條圖, step以橫線標示數值.
- 'bar’ is a traditional bar-type histogram. If multiple data are given the bars are arranged side by side.
- ‘barstacked’ is a bar-type histogram where multiple data are stacked on top of each other.
- ‘step’ generates a lineplot that is by default unfilled.
- ‘stepfilled’ generates a lineplot that is by default filled.
- binning(n) 資料有n個binning(x軸切成n等分累積畫圖),
- normed=False, 資料在作圖時不作歸一化.
- plt.show() 圖形設定完畢,開始作圖
result