Lesson 04 define funations then plot 自訂函數並作圖
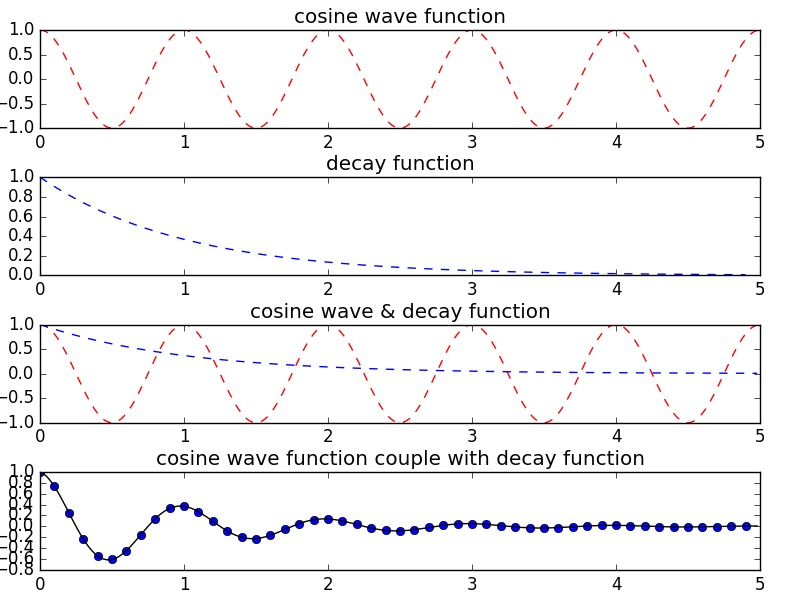
定義decay與cosine函式,並作圖.
 Code
Code
- import numpy as np;
- import matplotlib.pyplot as plt;
- def Decay(t):
- return np.exp(-t)
- def SHO(t):
- return np.cos(2*np.pi*t)
- def dampping(t):
- return np.exp(-t)*np.cos(2*np.pi*t)
- t1 = np.arange(0.0, 5.0, 0.1)
- t2 = np.arange(0.0, 5.0, 0.02)
- plt.figure(1)
- plt.subplot(411)
- plt.title(r'cosine wave function')
- plt.plot(t2, np.cos(2*np.pi*t2), 'r--')
- plt.subplot(412)
- plt.title(r'decay function')
- plt.plot(t1, Decay(t1), 'b--')
- plt.subplot(413)
- plt.title(r'cosine wave & decay function')
- plt.plot(t2, SHO(t2), 'r--', t2, Decay(t2), 'b--')
- plt.subplot(414)
- plt.title(r'cosine wave function couple with decay function')
- plt.plot(t1, dampping(t1), 'bo', t2, dampping(t2), 'k')
- plt.subplots_adjust(hspace=0.5, left=0.05, right=0.95, bottom=0.05, top=0.95)
- plt.show()
Note and Comments
- def Decay(t): 定義一個名為Decay的函式, 並以t爲變數, 並以":"作為函式內容的開端
- return np.exp(-t) 函式的內容寫在宣告的下一行, 並以"tab"縮排來表示函式內容範圍.以此Dacy(t)函式為例, 此函式的內容爲return np.exp(-t). return 是將"return"後面的結果由Decay(t)程式回傳到原呼叫程式. 在此例中回傳的是指數衰減的函數結果
- def SHO(t): 定義一個名為SHO的函式, 並以t爲變數, 內容爲餘弦的值
- plt.figure(1) 創造一個畫圖物件, 我們接下來會用subplot指令將其他副圖填進此物件內
- plt.subplot(411) 宣告原物件有副圖,此宣告的原型是subplot(l,m,n,), 用意是原本的figure 將被拆爲直向l個,橫向m個的圖, 並接我們將使用第n個副圖
- r--, b--, bo 繪圖的樣式; r, b 指的是顏色(紅色red與藍色blue),--指的是虛線, bo指得是藍色("b")的圓點("o")
- plt.subplots_adjust(hspace=0.5, left=0.05, right=0.95, bottom=0.05, top=0.95) 調整圖形配置hspace:圖形間隙, left:左邊邊界起點, right:右邊邊界終點
bottom:下方邊界起點, top:上方邊界終點